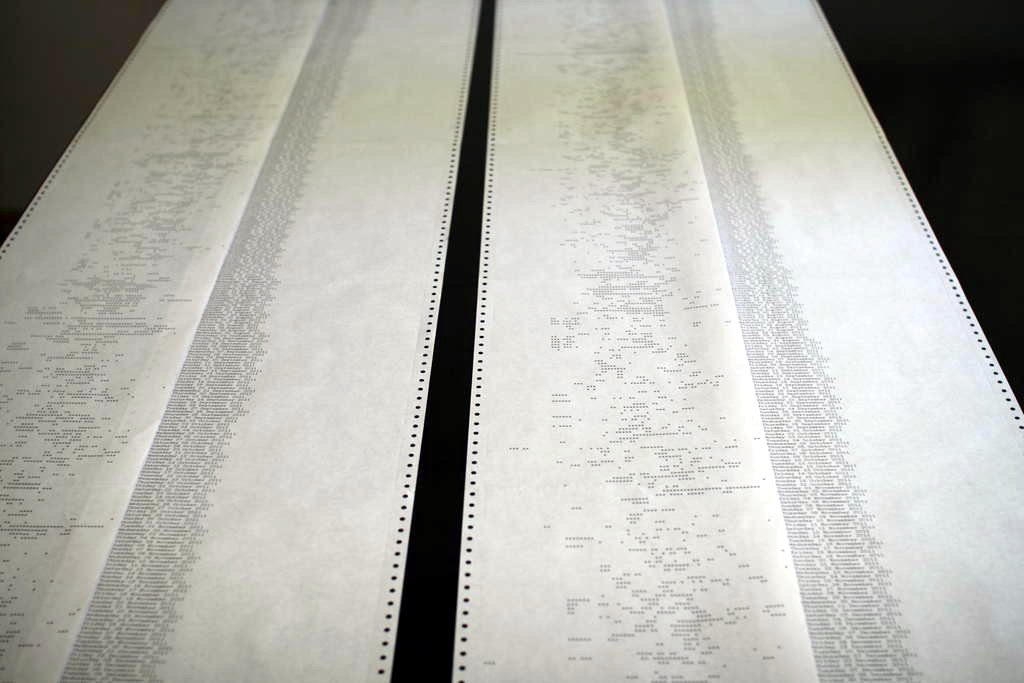
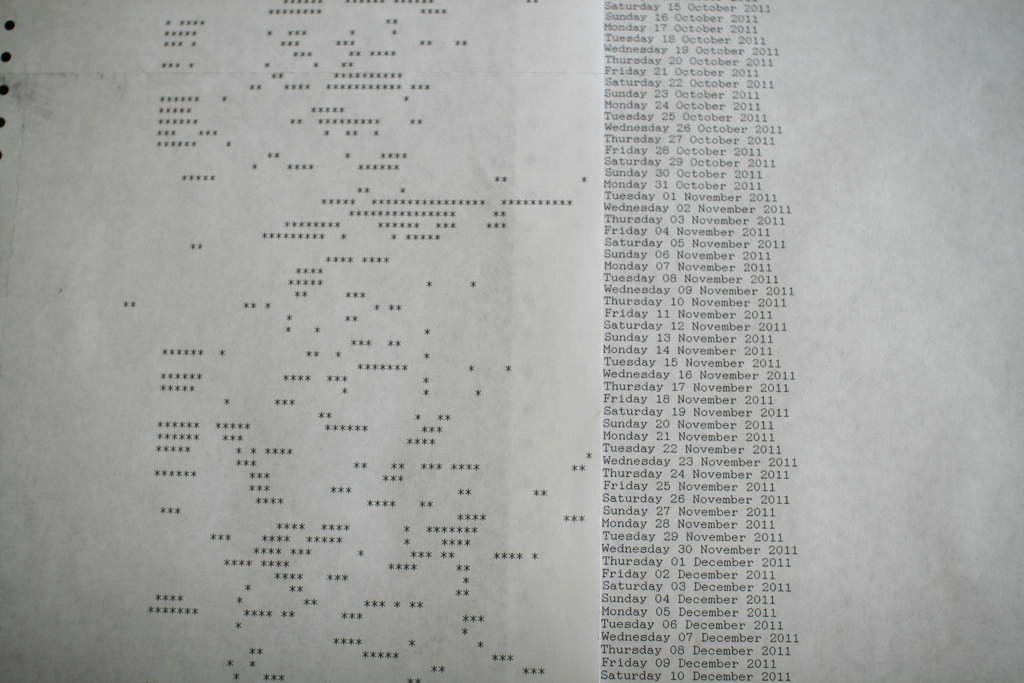
Jacquard loom GPS visualisation
We are getting increasingly attracted to older ways of visualising our GPS data - getting it out of the digital and especially screen realm and into tangible, haptic objects. Last week, after helping Martin print some data he is working on on Miles’s dot matrix printer which is still down our studio, I was inspired to write some python code to query our GPS database and produce an ASCII-style visualisation of when we record data with our GPS and when not

