What GPS to use

This is a follow up to this post ages ago outlining the technical aspects of our GPS data collection for those that might want to do something similar.

What GPS?
As mentioned in that earlier article, Sophia and I now use the old Garmin eTrex with the low-sensitivity chips.

Garmin eTrex Pros:

  • A screen – you get a lot of feedback
  • Standard AA batteries – when you’re out and about and you run out of batteries, these are easy to find in any shop, petrol station etc.
  • Durable – you just turn them on and forget about them
  • Standard – these things have been around in pretty much the same form for ages – there’s plenty of support and you won’t run into the problem of a GPS you can’t get the tracks off because its in some funky proprietary format.

Garmin eTrex Cons:

  • Big(ish) if its stealth you’re after, these yellow beauties are not for you – lots of people ask us about our ‘old fashioned mobiles’…
  • Standard AA batteries – they don’t last an awful long time so if you’re wandering in the mountains far from petrol stations and the like, you’d better have a ready supply of them.
  • Downloading cable – to transfer your tracks from the GPS to your computer, you’ll need a special cable. These are relatively expensive to buy from Garmin but you can make your own but either way, you’ll need a serial-to-usb converter

Another approach we’ve tried is the datalogger. This is what we like to give to people we are asking to contribute their GPS traces to a project, like A Day in the Life – The Walkers of Birmingham. They are usually little black rectangular objects you just turn on and forget about. We have been happy with the ones from Qstarz like the BT-Q1000XT. They’ve gotten expensive in the last few years though, becoming more than the Garmin above for much less hardware i.e. no screen etc.

A word of warning – don’t be confused by the modules you’ll see coming up near this search if you’re looking on Amazon or something similar (Qstarz BT-Q818XT for instance). Some of these are only GPSs which don’t save any tracks themselves (these are meant to be used in conjunction with a phone/computer/pda to store stuff).

Datalogger Pros:

  • Small – if you want to slip this away in a bag and forget you’re logging, or indeed slip it into someone else’s bag, although I wouldn’t recommend it – this is for you.
  • No distraction – sometimes you don’t want to scare people with a screen full of information
  • Durable – turn on, forget
  • Cell phone batteries – these last much longer than AAs. You can have these things running for days without worrying about running out of power.

Datalogger Cons:

  • Compatability – Not always standard – you have to watch out, even if you can install the (usually awful) software they are bundled with and if you are on a MAC and especially Linux, this is not a given, you sometimes can’t get the data into a form you can use anywhere i.e. GPX. Don’t be fooled by a usb connection into thinking this is compatible with your system.
  • Cell phone batteries – if you have a power socket you can plug into at the end of the day, you can charge these up. If not, forget it.
  • Switching off in your bag. The slider switches on these sometimes get turned off if they slip against other objects or the lining of a pocket etc. There’s nothing more disappointing than going on a long walk only to find the thing switched off when you put it in your pocket.
  • Feedback – there are often an occult series of flashes from the onboard leds to tell you whats going on which differ from model to model. There is feedback, but its minimal.
Posted in GPS, Software, Walking | Tagged , | Comments Off on What GPS to use

Speed Map of Berlin

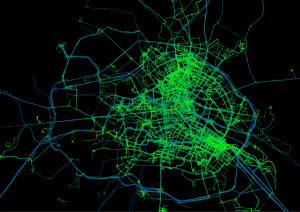
I’ve been experimenting with Mathieu Baudier’s PostgreSQL / PostGIS importer for our tracks (I’ll write about this later soon) and visualising my database of tracks in QGIS. Many possibilities become available. Mathieu’s importer calculates speed for every vector in the database so that you can perform queries in QGIS as well as defining what colour the line is drawn by speed. Here are some early results:

Speed Map of Berlin

All Journeys in Berlin between April 2003 and June 2010 lines coloured by Speed

In this map, the speeds are split into five different categories and the vectors are coloured accordingly. 0-8 kph being the bright green which is broadly speaking a walking range. Notice also how the road and rail networks declare themselves in blue.

Walking Map of Berlin

All Journeys in Berlin between April 2003 and June 2010 filtered to show speeds below 6 kph

Here I have performed a query on the database, filtering out all vectors with a calculated speed of more than 6 kph. I find it interesting to see where I walk and it shows very clearly the three places we have lived in Berlin during this time as three thicker areas.

Posted in GPS, Linux, Walking | Tagged , , , , , , , , | Comments Off on Speed Map of Berlin

Visit to the Konrad Zuze exhibit at the Technical Museum with Martin

I decided to take Martin’s Skrying board with me to the Technical Museum where we both wanted to see the Zuse display which is itself a confusing and patronising combination of hi- and lo-tech with ‘books’ with inbuilt speakers you can’t turn the sound off of and displays you have to press to keep the sound going. It was somehow great to see the replica of the Z1 though and realise how mechanical it all was. Couldn’t help wonder how it all really works and found this site that helps.

Zuse Z1 in the Technical Museum, Berlin

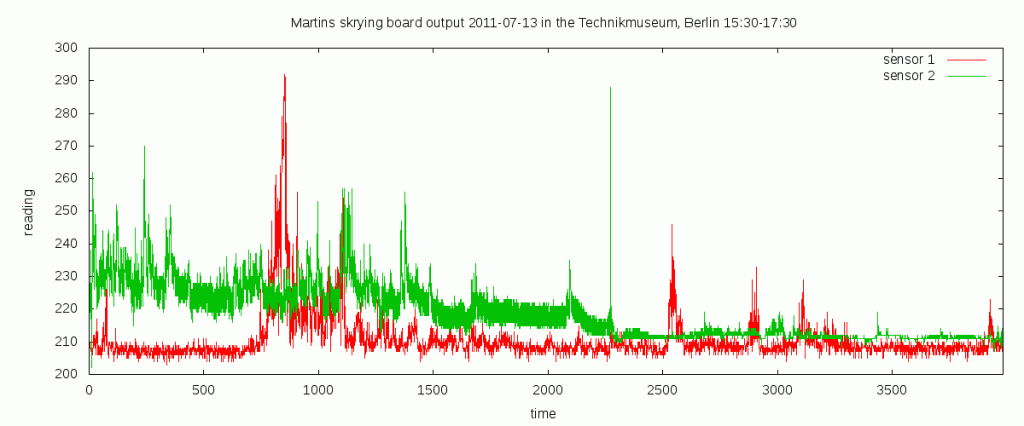
I guess the need to take some sort of recording was prompted by my lack of GPS coverage and recording of our experience and I was curious to find out what the electromagnetic landscape of a technical museum would look like. This time I was careful to put the Skrying board away from my phone, wallet etc and wear it on my chest in the pouch I normally tuck my mobile into.

I wonder if the peak in the red (sensor 1) reading is when we reached the Zuse exibit? It’s difficult to tell as the readings are taken every two or so seconds and although I started recording at 15:30, I’m not sure when the peak is or when we entered the display area. This would be solved by timestamping the readings (Martin?). I also suspect that the trailing off of reading intensity over time is due to old batteries running down (I can solve that one).

Skrying 2011-07-13

Gnuplot chart from Martin's skrying board

Posted in Diary | Tagged , , , , | Comments Off on Visit to the Konrad Zuze exhibit at the Technical Museum with Martin

Gnuplot as a GIS part 2

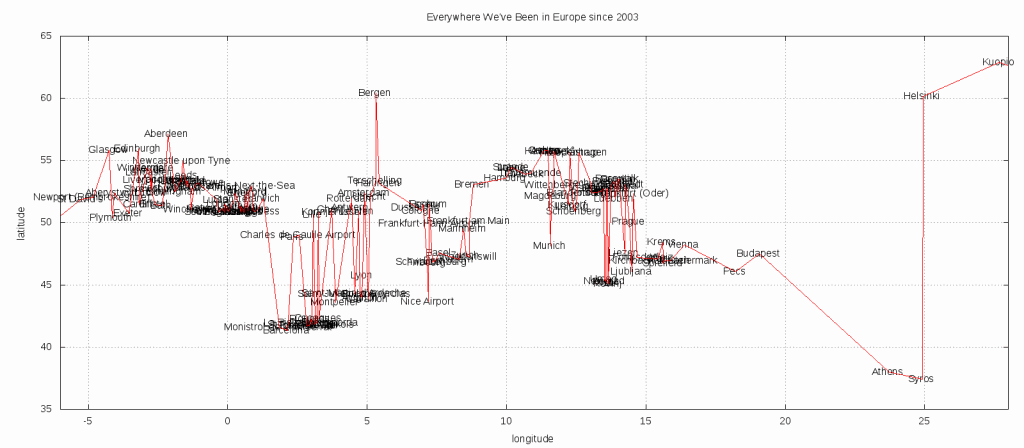
I liked using gnuplot in this way so much, I decided to hone in on Europe, of course the densest information in the data source. Constraining the range of the longitude to 6 degrees West to 23 degrees East, you get the chart below.

Locations in Europe

Gnuplot chart of locations in Europe since 2003

#!/usr/local/bin/gnuplot -persist
set terminal png size 1600, 700
set output "EuropeLocation.png"
set grid
set title "Everywhere We've Been in Europe since 2003"
set datafile separator "|"
#set xrange [-150:170] # full range
set xrange [-6:28] # Europe only
set xlabel "longitude"
set ylabel "latitude"
set style line 1 lc rgb "red"
plot './location.dat' using 3:4:1 notitle with labels,'./location.dat' using 3:4 notitle with lines ls 1;
Posted in Code, Diary, Linux | Tagged , , , | Comments Off on Gnuplot as a GIS part 2

A New Way of Looking at Where We’ve Been

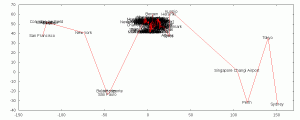
Tinkering with gnuplot again tonight, waiting for Soph to come back from Essen, I was using the charting software to visualise the list of locations in our gps database, sorted by longitude which gives a list of locations we’ve been too from West to East. Here’s the chart:

gnuplot locations chart

Everywhere we've been as a chart

Here is the data:

San Francisco|USA|-122.4192|37.7793
Columbia Ice Field|Canada|-117.313266|52.17849
Lake Louise|Canada|-116.174636|51.423413
Banff|Canada|-115.55|51.15
Calgary|Canada|-114.1|51.1
New York|USA|-74.0|40.716667
São Paulo|Brazil|-46.65585|-23.562691
Inhotim|Brazil|-44.21875|-20.12431
Belo Horizonte|Brazil|-43.936901|-19.921667
St David's|UK|-5.266001|51.88109
Newport (Pembrokeshire)|UK|-4.83607|52.01975
Glasgow|UK|-4.259|55.858
Plymouth|UK|-4.142431|50.371397
Aberystwyth|UK|-4.082053|52.413227
Exeter|UK|-3.533617|50.7218
Edinburgh|UK|-3.195637|55.950845
Cardiff|UK|-3.186667|51.485278
Liverpool|UK|-2.975137|53.405175
Windermere|UK|-2.9076|54.3761
Arnside|UK|-2.832|54.199
Lancaster|UK|-2.799614|54.047958
Shrewsbury|UK|-2.748072|52.710341
Kendal|UK|-2.745048|54.326069
Ludlow|UK|-2.7176|52.3681
Bristol|UK|-2.6|51.45
Bath|UK|-2.358112|51.382862
Manchester|UK|-2.233333|53.466667
Aberdeen|UK|-2.15|57.15
Birmingham|UK|-1.89955|52.479468
Bamford|UK|-1.688719|53.349289
Hathersage|UK|-1.656039|53.330105
Newcastle upon Tyne|UK|-1.6132|54.974
Leeds|UK|-1.549167|53.799722
Derby|UK|-1.475547|52.921855
Sheffield|UK|-1.470332|53.380778
East Midlands Airport|UK|-1.330149|52.826892
Winchester|UK|-1.323144|51.06308
Nottingham|UK|-1.2|52.95
Edwinstowe|UK|-1.064069|53.195613
Luton|UK|-0.4|51.85
South Lancing|UK|-0.325191|50.832046
Gatwick Airport|UK|-0.183237|51.151692
Brighton|UK|-0.131312|50.842941
Burgess Hill|UK|-0.13078|50.954159
Haywards Heath|UK|-0.10527|51.005268
London|UK|-0.1|51.5
Lewes|UK|0.017855|50.875627
Stansted|UK|0.235|51.885
Ely|UK|0.262299|52.399677
Bexhill|UK|0.46823|50.845348
Burham|UK|0.48308|51.32971
Hastings|UK|0.57734|50.857151
Mundford|UK|0.656948|52.512138
Rye|UK|0.73083|50.95219
Thetford|UK|0.749624|52.416157
Wells-Next-the-Sea|UK|0.854037|52.955067
Lydd|UK|0.91202|50.951389
Dungeness|UK|0.97628|50.914909
Hythe|UK|1.0763|51.07095
Harwich|UK|1.287471|51.945824
Monistrol de Montserrat|Spain|1.843934|41.602143
Barcelona|Spain|2.15|41.35
Paris|France|2.346665|48.855256
Charles de Gaulle Airport|France|2.552615|49.010104
Lloret de Mar|Spain|2.838947|41.700587
Tossa de Mar|Spain|2.933403|41.719739
Figueres|Spain|2.971835|42.262697
La Bisbal d'Emporda|Spain|3.027239|41.959905
St Feliu de Guixols|Spain|3.033441|41.781755
Lille|France|3.070347|50.636799
Palamos|Spain|3.133154|41.854975
Palafrugell|Spain|3.160362|41.918181
Begur|Spain|3.206753|41.95401
Kortrijk|Belgium|3.25|50.85
Cadaques|Spain|3.280353|42.284555
Ghent|Belgium|3.733333|51.05
Montpelier|France|3.877332|43.610747
Brussels|Belgium|4.3525|50.846667
Antwerp|Belgium|4.414755|51.217423
Rotterdam|Netherlands|4.454667|51.910239
Saint-Julien-de-Peyrolas|France|4.565174|44.286878
Saint-Martin-d'Ardeche|France|4.567663|44.301429
Leuven|Belgium|4.7|50.883333
Bollene|France|4.75074|44.283242
Avignon|France|4.808761|43.948818
Lyon|France|4.84142|45.757705
Amsterdam|Netherlands|4.899914|52.372535
Cavaillon|France|5.039388|43.83156
Utrecht|Netherlands|5.111014|52.091156
Terschelling|Netherlands|5.308296|53.389072
Bergen|Norway|5.32594|60.394871
Harlingen|Netherlands|5.431162|53.176363
Dusseldorf|Germany|6.783333|51.233333
Cologne|Germany|6.9583|50.9413
Essen|Germany|7.013056|51.450833
Fribourg|Switzerland|7.151282|46.803645
Nice Airport|France|7.203866|43.659862
Bochum|Germany|7.217538|51.481966
Frankfurt-Hahn Airport|Germany|7.269645|49.947258
Schwarzenburg|Switzerland|7.342976|46.819145
Bern|Switzerland|7.44754|46.948084
Basel|Switzerland|7.587102|47.553297
Luzern|Switzerland|8.309172|47.051974
Mannheim|Germany|8.471618|49.511818
Zurich|Switzerland|8.55|47.35
Waedenswill|Switzerland|8.675006|47.230148
Frankfurt am Main|Germany|8.679683|50.11345
Bremen|Germany|8.804094|53.079257
Hamburg|Germany|9.983|53.583
Kiel|Germay|10.137377|54.319431
Strande|Germany|10.17409|54.438801
Laboe|Germany|10.225224|54.402344
Luebeck|Germany|10.686389|53.869722
Travemuende|Germany|10.878155|53.962638
Havnsø|Denmark|11.33171|55.75132
Ordrup|Denmark|11.38134|55.80825
Asnæs|Denmark|11.49822|55.81248
Munich|Germany|11.574709|48.138531
Magdeburg|Germany|11.616667|52.133333
Wittenberge|Germany|11.694|53.0
Holbaek|Denmark|11.71082|55.71793
Kursdorf|Germany|12.236389|51.423889
Høje Tåstrup|Denmark|12.26849|55.6474
Leipzig|Germany|12.383333|51.333333
Schoenberg|Germany|12.45|50.9
Brandenburg|Germany|12.552|52.412
Copenhagen|Denmark|12.6|55.65
Stechlinsee|Germany|13.033744|53.148186
Potsdam|Germany|13.06|52.4
Berlin|Germany|13.37|52.51
Liepnitzsee|Germany|13.498866|52.743275
Umag|Croatia|13.522272|45.432364
Novigrad|Croatia|13.563299|45.316853
Bernau|Germany|13.588259|52.678965
Porec|Croatia|13.596344|45.227607
Vrsar|Croatia|13.606909|45.149608
Biesnethal|Germany|13.629976|52.766476
Rovinj|Croatia|13.643894|45.083141
Joachimsthal|Germany|13.749277|52.979352
Prenzlau|Germany|13.86575|53.316784
Warnitz|Germany|13.872697|53.178113
Luebben|Germany|13.9|51.95
Pasewalk|Germany|13.993509|53.505442
Broellin|Germany|14.049985|53.461045
Liezen|Austria|14.24207|47.568022
Schwedt|Germany|14.266667|53.05
Prague|Czech Republic|14.4|50.1
Ljubljana|Slovenia|14.505556|46.051389
Frankfurt (Oder)|Germany|14.55|52.35
Fohnsdorf|Austria|14.678262|47.207852
Graz|Austria|15.438889|47.070278
Krems|Austria|15.610278|48.410833
Weiz|Austria|15.624803|47.217544
Spielfeld|Austria|15.630553|46.709056
Kirchbach in Steiermark|Austria|15.661452|46.931996
Feldbach|Austria|15.888732|46.955077
Vienna|Austria|16.373056|48.208333
Pecs|Hungary|18.2213|46.075481
Budapest|Hungary|19.062161|47.497951
Athens|Greece|23.724622|37.985004
Syros|Greece|24.923506|37.439379
Helsinki|Finland|24.942539|60.16741
Kuopio|Finland|27.677448|62.892152
Singapore Changi Airport|Singapore|103.989303|1.36299
Perth|Australia|115.848948|-31.985434
Tokyo|Japan|139.95|35.65
Sydney|Australia|151.208595|-33.868761
Posted in Code, Diary, Linux | Tagged , , , | Comments Off on A New Way of Looking at Where We’ve Been